
new analysis of monthly Census Bureau data by the Center for Immigration Studies shows that the nation's immigrant population (legal and illegal) hit a record high of 42.1 million in the second quarter of this year — an increase of 1.7 million since the same quarter of 2014. Growth in the immigrant population in the last year was led by a 740,000 increase in the number of Mexican immigrants. After falling or growing little in recent years, the number of Mexican immigrants again seems to be growing significantly. The monthly Census Bureau data, referred to as the Current Population Survey (CPS), is released before other data. As more information becomes available, it should confirm the findings from the CPS.1
Among the findings:
- The nation's immigrant (foreign-born) population, which includes legal and illegal immigrants, grew by 4.1 million from the second quarter of 2011 to the second quarter of 2015 — 1.7 million in just the last year.
- Immigrants are 13.3 percent of the nation's total population — the largest share in 105 years.
- Growth in the last year was led by a rebound in the number of Mexican immigrants, which increased by 740,000 from 2014 to 2015 — accounting for 44 percent of the increase in the total immigrant population in the last year.
- The total Mexican immigrant population (legal and illegal) reached 12.1 million in the second quarter of 2015 — the highest quarterly total ever.
- Prior research has indicated that net migration (the number coming vs. leaving) from Mexico had fallen to zero; the recent growth indicates that the period of zero net migration has ended.
- In addition to Mexico, growth in the immigrant population was led by a 449,000 increase in the last year from countries in Latin America other than Mexico.
- The Department of Homeland Security and other researchers have estimated that eight in 10 illegal immigrants are from Mexico and Latin America, so the increase in immigrants from these countries is an indication that illegal immigration has begun growing again.
- The number of immigrants in the United States is now enormous, but it must be recognized that most immigrants, including those from Latin America, are in the country legally. Absent a change in legal immigration policy, the immigrant population will continue to increase.
Overview
Given the significant cutbacks in enforcement in recent years, the permissive nature of the legal immigration system, and improvements in the economy, it is not surprising that the immigrant (legal and illegal) population has surged in the last four years. The immigrant population, referred to as the foreign-born by the Census Bureau, consists of those residing in the United States who were not American citizens at birth; it includes those in the country illegally.2 We use the terms immigrant and foreign-born synonymously in this report.
After growing little from 2007 to 2011, the nation's immigrant population has grown by 4.1 million from 2011 to 2015. This is roughly equal to the pace of growth from 2000 to 2007. The 1.7 million growth in the immigrant population (legal and illegal) from 2014 to 2015 is one of the largest single-year increases from the same quarter of the prior year since 2000. Both the growth from 2011 to 2015 and the increase in the last year are statistically significant (see Table 1 and Figure 1).

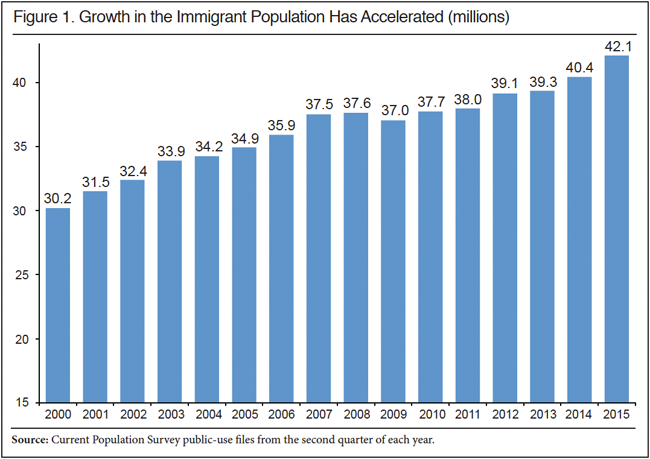
For the immigrant population to increase by one million means that significantly more than one million new immigrants must enter the country because some immigrants already here return to their homeland each year and natural mortality totals 250,000 annually.3 The number of deaths changes little from year to year and births in the United States cannot add to the immigrant population because all those born to immigrants are by definition not foreign-born and are automatically given American citizenship. Thus, a change in migration patterns with more immigrants coming or fewer leaving is the only way that the foreign-born population can grow.4
Figure 2 shows the number of immigrants who arrived in the three years prior to each year. So the figure reads as follows: In the second quarter of 2015, there were 4.2 million immigrants who indicated they first came to the country in 2012 or later. Figure 2 reports arrivals only for odd-numbered years because of the way the Census Bureau groups individual years of arrival in the public-use data of the CPS. This is done to preserve the anonymity of respondents. In the even-numbered years the grouping is for two-year cohorts.

By looking only at odd-numbered years, Figure 2 compares arrival cohorts of equal length — three years plus the first few months of the calendar year of the survey. So, for example, the 4.2 million new arrivals in 2015 is a good deal more than the 3.1 million who arrived in the three years prior to 2013. The number of recent arrivals in 2015 is very similar to the number of new arrivals in 2005 and 2007, but less than the number arriving in the three years prior to 2003.5 In addition to the significant growth in the foreign-born population shown in Figure 1, the increase in the number of new arrivals is further evidence that the level of new immigration has increased in the last few years.
Other Data Sources
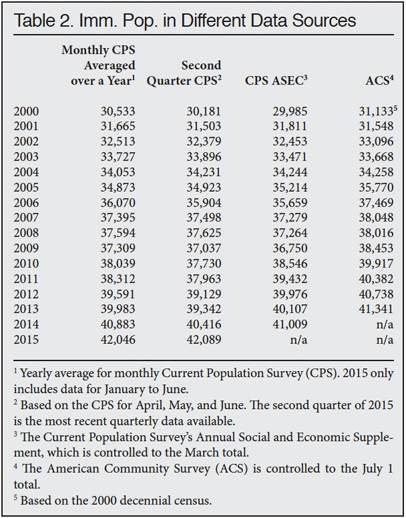
While released first, the monthly CPS is not the only source of information on immigrants from the Census Bureau. In March of each year, the Bureau over-samples minorities and collects the Current Population Survey's Annual Social and Economic Supplements, often abbreviated as CPS ASEC or just ASEC. The Census Bureau has announced that the 2015 ASEC will be made available to the public on September 16 of this year. In addition to the ASEC, there is also the American Community Survey (ACS), which is the largest Census Bureau survey. It is often used to measure the total size of the immigrant population. It is collected throughout the year and the Bureau will release information from it on September 17 of this year, but for 2014, not 2015.6 The ACS is controlled to a July 1 total, so even when it is released next month it will be almost one year behind the monthly CPS data from the second quarter of 2015 used in this analysis.7
Table 2 compares monthly data from the CPS to the ASEC and the ACS. The table shows that the ASEC produces a foreign-born estimate that is within about 1 percent of the monthly CPS from the second quarter of the same year. The ACS from each year produces an estimate that is about 3 percent larger than the monthly CPS from the second quarter of the same year.8 However, the difference has tended to increase, from 4 percent in 2010 to 6 percent in 2013. Nonetheless, all the Census surveys show similar numbers and trends.9 It is likely that when the 2014 ACS is released next month it will show somewhat over 42 million immigrants and the 2015 ACS when released next year will show roughly 44 million. As more Census Bureau data is released it should confirm what the monthly CPS data shows — significant growth in the foreign-born population in the last few years.
Mexican Immigrants
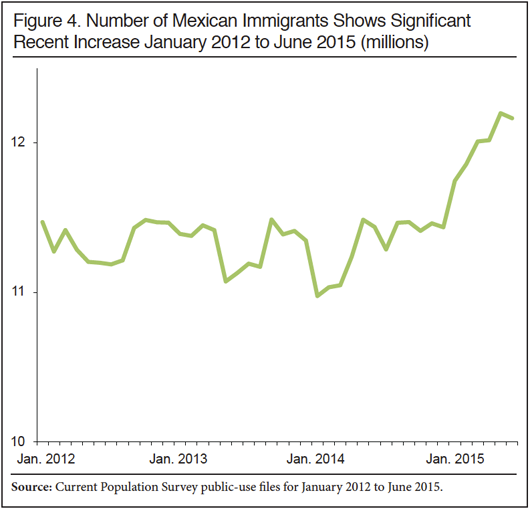
It has been widely reported that net migration from Mexico (the number leaving vs. the number coming) fell to zero.10 While estimates of out-migration in particular contain a good deal of uncertainty, there is less uncertainty when looking at the size and growth of the total Mexican immigrant population. As Figure 3 shows, there was little to no growth or an outright decline in the Mexican immigrant population from 2008 to 2013. This lends strong support to the idea that net migration was zero or perhaps even negative from Mexico during this time period. However, something seems to have changed in the last 18 months. The quarterly data shows an increase of 740,000 from the second quarter of 2014 to the same quarter of this year (Table 3 and Figure 3).11 Looking at individual months also shows the same upturn in the number of Mexican immigrants in the Unites States. Figure 4 shows month-to-month fluctuations in the Mexican immigrant population, which is partly related to seasonality; but there is no clear trend until 2014. From January 2014 to December 2014, the Mexican immigrant population grew by slightly more than 460,000. So far this year (January to June), the Mexican population has increased by 419,000.


For the last few decades, Mexico has been the top sending country to the United States for both legal and illegal immigration. It must be emphasized that this was the case even from 2008 to 2013, when the pace of immigration slowed from that country. Mexico was the top sending country for new green card recipients in every year from 2009 to 2013. Mexico sent roughly twice as many each year as the next biggest sending country, China.12However, not all of these green cards went to new arrivals. In addition to being the top sending country for legal immigration, the Department of Homeland Security and other researchers also have estimated that more than half of all illegal immigrants are from Mexico.13 The recent increase in the number of immigrants from Mexico is an indication that the number of new illegal im¬migrants entering the country is increasing.14
One cautionary note is in order: it is not known if the increase in the Mexican immigrant population represents a longer-term trend or just a one-year spike. What we can say is that the growth in the Mexican immigrant population in the last year is large and statically significant. (For confidence intervals surrounding the Mexican immigrant population, see Table 1.)
Illegal Immigrants. It is important to understand that illegal immigration, like immigration generally, is a dynamic process, with new immigrants arriving each year and some returning home. In the case of illegal immigration, in addition to deaths and return migration, new arrivals are also offset by those who remain in the country, but change their status from illegal to legal each year. Since 2009, some 2.5 million new illegals have settled in the country, with Mexico as the top sending country.15 But these new arrivals were offset by those getting legal status, going home, or dying.
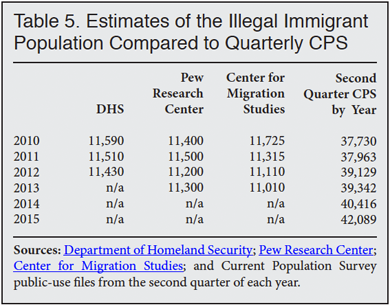
It is well established that illegal immigrants respond to Census Bureau surveys. In fact, researchers have used Census Bureau data as the basis to estimate the size and composition of the illegal population. Table 5 reports estimates of the illegal immigrant population from DHS, the Pew Research Center, and the Center for Migration Studies (CMS) compared to the total immigrant population in the second quarter of the same year. All of these estimates are based on Census Bureau surveys. The ratio of immigrants to the illegal population in the second quarter over the years as estimated by these three organizations varies from a high of 3.57:1 to a low of 3.22:1. Averaging all three organization's estimates results in a ratio of 3.38:1. Using this average ratio implies that the illegal population could be 12.4 million in 2015. If correct, this would mean that the illegal population grew significantly since 2013, when Pew and CMS last estimated its size. Of course, this represents only an educated guess. To actually estimate the illegal population in the second quarter of 2015 would require administrative data that is not yet available, as well as other information. But the evidence, while preliminary and incomplete, does indicate that the number of illegal immigrants has increased in the last two years.
As we have seen, the increase in the Mexico-born population in the last year suggests that illegal immigration has increased. In addition to Mexico, growth in the immigrant population was led by a 449,000 increase in the number of immigrants from other Latin American countries in the last year. This 449,000 accounted for 27 percent of the growth in the total foreign-born population since 2014. Looking at growth in the last two years shows a 2.75 million increase in the immigrant population (See Figure 1 and Table 1). Mexico accounted for 921,000 (34 percent) of this growth and other Latin American countries accounted for 953,000 (35 percent). Most researchers have estimated that individuals from Mexico and Latin America accounted for eight in 10 illegal immigrants in the country.16 The significant growth of immigrants from all of Latin America over the last two years lends support to the idea that the number of illegal immigrants has begun to increase again.
Conclusion
The most up-to-date Census Bureau data is from the monthly Current Population Survey. The survey shows significant growth in the nation's immigrant (legal and illegal) population since 2011, after a period of no significant growth. In the last two years, the growth in the immigrant population has been largely driven by immigrants from Mexico and the rest of Latin America. This suggests that illegal immigration has increased in recent years after having declined or grown little from 2009 to 2013. However, it must be remembered that legal immigrants significantly outnumber illegal immigrants. Of the more than 42 million immigrants living in the country in the second quarter of 2015, roughly three-quarters are in the country legally. While the impact of illegal immigration is often the subject of intense national debate, the much larger flow of legal immigrants has seen almost no discussion, even though its impact on American society is much larger.
End Notes
1 The Current Population Survey is sometimes referred to as the Household Survey and is primarily collected to measure unemployment, labor force participation, and other aspects of the nation's labor force.
2 It includes naturalized citizens, permanent residents (green card holders), long-term temporary visitors (e.g. guest workers and foreign students), and illegal immigrants.
3 The number of new immigrants arriving is much larger than the growth in the immigrant population because each year roughly half a million immigrants die or return home. Return migration and deaths offset new arrivals. We can see how new arrivals are offset by deaths and out-migration by looking at the most recent data. As Figure 1 and Table 1 show, the immigrant population grew by three million from the second quarter of 2012 to the second quarter of 2015. Figure 2 shows there were 4.24 million new immigrants in the country in 2015 who indicated in the survey that they came in 2012 or later. The 1.24 million difference between these numbers provides a very rough estimate of return-migration and deaths. This comparison is only a crude measure of deaths and out-migration because some immigrants, who had been in the country earlier, but left and then returned between 2012 to 2015, would not show up as new arrivals in the 2015 data. However they would directly add to the size of the immigrant population. Also, the undercount of new arrivals is almost certainly larger than the undercount of the overall immigrant population, which is a much more established population. For a more detailed discussion of deaths and out-migration, see the "Deaths and Out Migration" section in Steven A. Camarota, Immigrants in the United States: A Profile of America's Foreign-Born Population, Washington, DC: Center for Immigration Studies, 2012.
4 Like all modern surveys, the Census Bureau weights the CPS and ACS based on a complex methodology that reflects what the Bureau thinks is the nation's actual population size by such key variables as race, sex, age, and ethnicity. The weighting procedure is specifically designed to produce accurate survey results even for populations that are difficult to capture in a survey. The weights are adjusted each January as new information becomes available to the Bureau. This re-weighting can impact year-to-year comparisons in things like the unemployment rate, income, and other information drawn from the CPS, including the size of the foreign-born population. However, the bureau's re-weighting cannot impact comparisons month-to-month within the same year. For more discussion of the methodology of the CPS see "Design and Methodology: Current Population Survey" , U.S. Department of Labor, October 2006.
5 The difference between the number of new arrivals in 2015 compared to 2013 is statistically significant. The number of new arrivals in 2015, 2007, and 2005 are all statistically equal, indicating that new immigration has returned to the level it was before the Great Recession.
6 "Census Bureau Announces Schedule for Income, Poverty and Health Insurance Statistics and American Community Survey Results", Census Bureau press release, July 30, 2015.
7 In addition to the monthly CPS, the ASEC, and the ACS, the Survey of Income and Program Participation (SIPP) also identifies immigrants. While much more detailed than the other surveys, it is typically released a few years after it is collected so it cannot be used to measure recent trends in immigration.
8 Part of the reason the ACS shows a bigger population than the CPS is that, unlike the CPS, it includes the institutional population (e.g. those in prisons and nursing homes).
9 This is to be expected as the surveys are weighted to similar population controls.
10 In a recent appearance, former President Bill Clinton made a point of arguing that there is little need to worry about illegal immigration because net migration from Mexico is zero. The Pew Research Center was the first to estimate that net migration was zero. See Jeffrey S. Passel, D'Vera Cohn, and Ana Gonzalez-Barrera, Net Migration from Mexico Falls to Zero — and Perhaps Less, Pew Hispanic Center, April 2012.
11 From 2000 to 2006 the countries in regions shown in Table 3 are as followings, Europe: Austria, Belgium, Czechoslovakia, Denmark, Finland, France, Germany, Greece, Hungary, Ireland, Italy, Holland/Netherlands, Norway, Poland, Portugal, Azores, Romania, Spain, Sweden, Switzerland, Great Britain, England, Scotland, Northern Ireland, Yugoslavia, Europe, Czech Republic, Slovakia/Slovak Republic, USSR, Latvia, Lithuania, Armenia, Russia, Ukraine; South Asia: Afghanistan, Bangladesh, India , Pakistan; East Asia: Burma, Cambodia, China, Hong Kong, Indonesia, Japan, Korea/South Korea, Laos, Malaysia, Philippines, Singapore, Taiwan, Thailand, Vietnam, Asia not specified; Middle East: Iran, Iraq, Israel, Jordan, Lebanon, Saudi Arabia, Syria, Turkey, Middle East, Palestine, Egypt, Morocco, North Africa; Sub-Saharan Africa: Ethiopia, Ghana, Kenya, Nigeria, South Africa, Tanzania, Other Africa; Latin America other than Mexico: Belize, Costa Rica, El Salvador, Guatemala, Honduras, Nicaragua, Panama, Central America, Bermuda, Bahamas, Barbados, Cuba, Dominica, Dominican Republic, Grenada, Haiti, Jamaica, Trinidad and Tobago, Caribbean Argentina, Bolivia, Brazil, Chile, Columbia, Ecuador, Guyana, Peru, Uruguay, Venezuela, and South America; Canada, Australia, and Other countries not specified. In 2007 the Census Bureau changed the countries identified in the CPS. From 2007 to 2015 the regions are as follows, Europe: Albania, Austria, Belgium, Bulgaria, Czechoslovakia, Denmark, Finland, France, Germany, Greece, Hungary, Iceland, Ireland, Italy, Netherlands, Norway, Poland, Portugal, Azores, Romania, Spain, Sweden, Switzerland, United Kingdom, England, Scotland, Northern Ireland, Yugoslavia, Czech Republic, Slovakia, Bosnia & Herzegovina, Croatia, Macedonia, Serbia, Estonia, Latvia, Lithuania, Armenia, Belarus, Georgia, Moldova, Russia, Ukraine, USSR, Montenegro, Cyprus, Kosovo and Europe not specified, South Asia: Afghanistan, Bangladesh, Bhutan, India, Nepal, Pakistan, and Sri Lanka; East Asia: Myanmar (Burma), Cambodia, China, Hong Kong, Indonesia, Japan, Korea, South Korea, Laos, Malaysia, Mongolia, Philippines, Singapore, Taiwan, Thailand, Vietnam, and Asia not specified; Middle East: Azerbaijan, Iran, Iraq, Israel, Jordan, Kazakhstan, Kuwait, Lebanon, Saudi Arabia, Syria, Turkey, United Arab Emirates, Uzbekistan, Yemen, Algeria, Egypt, Libya, Morocco, and Sudan; Latin American Other than Mexico: Belize, Costa Rica, El Salvador, Guatemala, Honduras, Nicaragua, Panama Bermuda, Antigua and Barbuda, Bahamas, Barbados, Cuba, Dominica, Dominican Republic, Grenada, Haiti, Jamaica, St. Kitts—Nevis, St. Lucia, St. Vincent and the Grenadines, Trinidad and Tobago, West Indies, not specified, Argentina, Bolivia, Brazil, Chile, Columbia, Ecuador, Guyana, Paraguay, Peru, Uruguay, Venezuela, South America not specified; Sub-Saharan Africa: Cameroon, Cape Verde, Congo, Ethiopia, Eritrea, Ghana, Guinea, Ivory Coast, Kenya, Liberia, Nigeria, Senegal, Sierra Leone, Somalia, South Africa, Tanzania, Togo, Uganda, Zaire, Zambia, Zimbabwe, and Africa not Specified; Canada, Australia, and Other countries not specified.
12 Lawful Permanent Residents Annual Flow Reports for 2013, 2012, and 2011, by Randall Monger and James Yank for the Department of Homeland Security.
13 DHS estimates of Mexican illegal immigrants by year can be found in Appendix Table 2 of Ryan Baker and Nancy Rytin, "Estimates of the Unauthorized Immigrant Population Residing in the United States: January 2012", Department of Homeland Security, March 2013. See also "Unauthorized Immigrants in the United States", Pew Hispanic Center, November 2014; and Robert Warren, "Democratizing Data about Unauthorized Residents in the United States: Estimates and Public-Use Data, 2010 to 2013", Journal on Migration and Human Security, Vol. 2 No. 4, 2014, pp. 305-328.
14 See Table 5 for estimates of the illegal immigrant from different organizations through 2013.
15 Steven A. Camarota, "2.5 Million Join Illegal Population under Obama: Pace slower than under Bush, but still enormous", Center for Immigration Studies, July 2015.
16 Ryan Baker and Nancy Rytin, "Estimates of the Unauthorized Immigrant Population Residing in the United States: January 2012", Department of Homeland Security, March 2013. See also <"Chapter 2: Birthplaces of U.S. Unauthorized Immigrants", in Jeffrey S. Passel, D'Vera Cohn, and Ana Gonzalez-Barrera, Net Migration from Mexico Falls to Zero — and Perhaps Less, Washington, DC: Pew Hispanic Center, April 2012.
http://cis.org/Immigrant-Population-Hits-Record-Second-Quarter-2015


No comments:
Post a Comment